Are Humans Really Causing Climate Change?
The climate police insist that “the science is settled.” Any disagreement with their position is censored. Of course, these people aren’t real scientists. Real scientists are skeptical. They know that science is never “the truth.” Instead, it’s a method to construct ever-improving approximations that allow ever-improving computations of observable phenomena. The only thing you can “prove” about a theory is that it’s false, or that a better one produces more accurate results. Ask the ghosts of Newton and Einstein. Especially for (most) academic scientists, proving that “science” is NOT settled might earn a Nobel Prize. Even a book or journal article about it puts a feather in their cap.
Politicians find “the science is settled” to be extremely useful to funnel enormous sums of public money to their donors and cronies.
Here are some reasons to doubt “the science is settled.”
Temperature and CO2 are unrelated
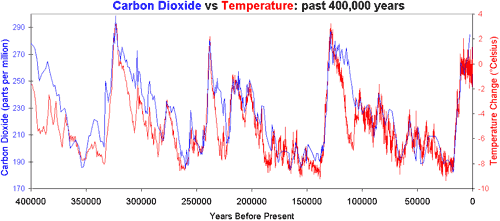
During the last 400,000 years, changes in the temperature of the atmosphere almost always preceded changes in the content of CO2 by 600–6000 years. Lawyers like to abuse a logically false legalistic Latin phrase: post hoc ergo propter hoc — after the thing therefore caused by the thing. The Apollo astronauts ate chicken and then went to the moon. I ate chicken. Hooray! I’m going to the moon! To use a corrected phrase Ante hoc ergo non propter hoc — Before the thing, therefore not caused by the thing.
See Eric Monnin et al, Atmospheric CO2 Concentrations over the Last Glacial Termination Science 291, 112 (2001) and https://courses.seas.harvard.edu/climate/eli/Courses/global-change-debates/Sources/Temperature-leads-CO2-in-ice-cores/more/Monnin-2001.pdf
During the last 600 million years, temperature and CO2 have been essentially unrelated.
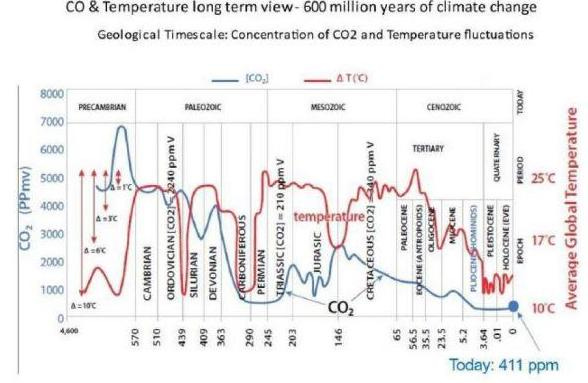
From C. R. Scotese, H. Song, B. J. W. Mills, and D. G. Van der Meer, Phanerozoic paleotemperatures: The Earth's changing climate during the last 540 million years, Earth-Science Reviews 215, 103503 (2021) https://doi.org/10.1016/j.earscirev.2021.103503 and Global Mean Surface Temperatures for 100 Phanerozoic Time Intervals
As seen in this graph, CO2 is not at an all-time high. It’s closer to an all-time low.
Read more complete discussion at Professors Challenge the Canard of Anthropogenic Climate Change.
The Sun is More Responsible for the Climate
Most of you have heard of the Sun’s eleven-year cycle. But it has several other activity cycles. Two of these resonate with a periodicity of about 1,500 ± 70 years. The Earth's temperature responds to these cycles, leaving a record in ice cores, stalactites, lake bed and ocean bottom sediments, tree rings, bogs, …, everywhere throughout the world. This is not a Northern Hemisphere Phenomenon as some claim.
These cycles are also evident in the historical record, going back to the pre-Roman Egyptian cooling (during which the Egyptians lost the battle of Carchemish to Nebuchadnezzar II and never recovered), the Roman warming, the Dark Ages, the Medieval warming, and the Little Ice Age, from which we are just now emerging. People didn't write “gee, the climate is cooling” (or warming) but Egyptians wrote about needing to build dams and canals, Romans grew grapes and citrus in Britain, Slavs moving up the Eastern Alps thought the Germans had abandoned the land because they got fat and lazy — and then they had to abandon the same land when the glaciers returned, ….
The cycles appeared in the 1995 IPCC report, …
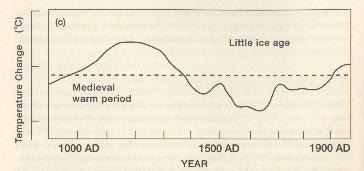
… but were removed in the 2001 report, at the insistence of the editor, Michael Mann, to preserve the illusion of the reality of his infamous “Hockey Stick” graph.
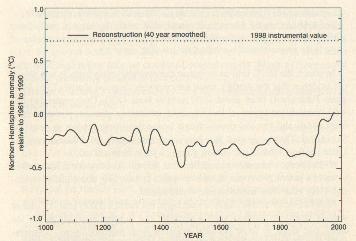
Read Unstoppable Global Warming — Every 1500 Years by Siegfried Fred Singer and Dennis T. Avery, ISBN-13: 978-0-7425-5116-9.
Start at the Minimum and Measure Only Increase
Analysis of ice cores by the Greenland Ice Project (GrIP) show that 1870 was the coldest year in Greenland in more than 8,000 years. 1870 was also about the time that widespread accurate temperature records began to be kept. If you begin measuring at a minimum, all you record is increase. Bill Maher calls this “presentism,” or “nothing actually happened before I was born.”
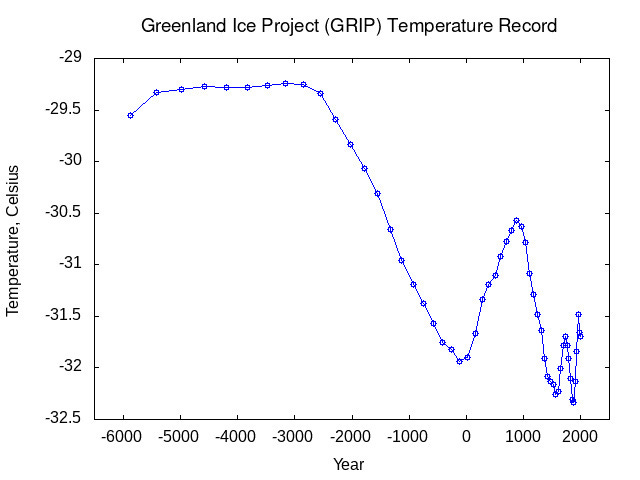
From https://www.iceandclimate.nbi.ku.dk/data/ddjtemp.txt:
In Greenland:
The warmth of the climatic optimum during the European stone age 5000 years ago is clearly seen, just as the cool period during the Roman age and the relative warmth of the Viking age (where the Norsemen settled in Iceland and Greenland) and the two cold periods of the “little ice age” at 1600 AD and 1875 AD. The warming in Greenland in the 20th century only lasts until 1950 AD. After that it has become colder.
How Much Does CO2 Actually Warm the Earth?
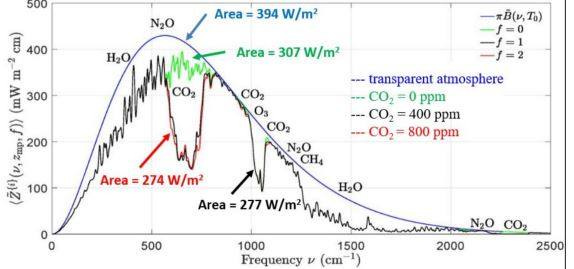
Ponder this graph. The area under each curve is Earth's radiated power. Reducing radiated power increases temperature. DOUBLING CO2 would change the Earth's radiation budget by 1.08% (Are you actually able to see a difference between the red and black curves?).
Each DOUBLING of CO2 concentration ADDS 0.84 degrees Celsius to the average Earth surface temperature, not the 3 degrees the IPCC uses to scare us. Read that again: A DOUBLING, not an increment from 400 to 500 ppmv.
Where Did All That CO2 Come From?
Even if increasing CO2 is causing global warming, where did the increase come from? The climate cult says it all came from burning fossil fuels. But real scientists beg to disagree. One might ask “How can one know where it came from?”
Carbon-14 is created only in the upper atmosphere by cosmic rays (or by atmospheric nuclear weapons testing, which was done for about 20 years). It is radioactive with a half life of 5,730 years. That means half of a given quantity of it will have decayed after 5,730 years, half of what's left after another 5,730 years, …. After ten half lives, 57,300 years for carbon-14, less than 0.1% of the original remains. You can do this calculation yourself. Dig out your calculator and enter 1.0. Then divide by 2.0 ten times.
Fossil fuels have been underground, not exposed to cosmic rays, for millions of years. They therefore do not contain any carbon-14: Burning fossil fuels dilutes the concentration of carbon-14 in atmospheric CO2.
If emissions of CO2 caused by burning fossil fuels were the only source for the observed increase of the total concentration of CO2 in the atmosphere since 1750, the trend of atmospheric dilution of CO2 containing carbon-14, or equivalently the relative increase in carbon-12 and carbon-13, as measured in stalactites, ice cores, lake bed and ocean bottom sediments, bogs, …, would be much more than observed.
Kenneth Skrable, George Chabot, and Clayton French reported their analysis of this in World Atmospheric CO2, Its 14C Specific Activity, Non-fossil Component, Anthropogenic Fossil Component, and Emissions (1750-2018), which appeared in Health Physics 122, 2 (1 February 2022) pp 291-305. From the abstract:
After 1750 and the onset of the industrial revolution, the anthropogenic fossil component and the non-fossil component in the total atmospheric CO2 concentration, C(t), began to increase. Despite the lack of knowledge of these two components, claims that all or most of the increase in C(t) since 1800 has been due to the anthropogenic fossil component have continued since they began in 1960 with the "Keeling Curve: Increase in CO2 from burning fossil fuel." Data and plots of annual anthropogenic fossil CO2 emissions and concentrations, C(t), published by the Energy Information Administration, are expanded in this paper. Additions include annual mean values in 1750 through 2018 of the 14C specific activity, concentrations of the two components, and their changes from values in 1750. The specific activity of 14C in the atmosphere gets reduced by a dilution effect when fossil CO2, which is devoid of 14C, enters the atmosphere. We have used the results of this effect to quantify the two components. All results covering the period from 1750 through 2018 are listed in a table and plotted in figures. These results negate claims that the increase in C(t) since 1800 has been dominated by the increase of the anthropogenic fossil component [my emphasis]. We determined that in 2018, atmospheric anthropogenic fossil CO2 represented 23% of the total emissions since 1750 with the remaining 77% in the exchange reservoirs. Our results show that the percentage of the total CO2 due to the use of fossil fuels from 1750 to 2018 increased from 0% in 1750 to 12% in 2018, much too low to be the cause of global warming.
“Coming Ice Age” Scientists are Singing a Different Tune Now
Stephen Schneider is one of the leaders of “the sky is falling” global warming cult. But look what he wrote, along with S. I. Rasool, on page 139 in Atmospheric Carbon Dioxide and Aerosols: Effects of Large Increases on Global Climate, which appeared in Science 173, 3992 (9 July 1971) pp 138-141:
From our calculation, a doubling of CO2, produces a tropospheric [lower atmosphere] temperature change of 0.8°K. However, as more CO2 is added to the atmosphere, the rate of temperature increase is proportionally less and less, and the increase eventually levels off. Even for an increase in CO2 by a factor of 10, the temperature increase does not exceed 2.5°K.
Therefore, the runaway greenhouse effect does not occur because the 15-μm CO2 band, which is the main source of absorption, “saturates,” and the addition of more CO2 does not substantially increase the infrared opacity of the atmosphere.
They wrote this at the time when “scientists” were worrying about the coming ice age. If burning fossil fuels couldn't prevent the coming ice age, how could burning fossil fuels cause global warming? If this is still a mystery, re-read the section above about how much CO2 warms the Earth.
What does “saturate” mean? Imagine you have a greenhouse in which visible light passes through the glass roof, strikes materials inside, and warms them. Then some of that heat is re-radiated as infrared light. Your greenhouse warms because the glass does not transmit infrared light as well as it transmits visible light. In other words, it holds heat inside. Suppose it retains 90% of the infrared light. If you add another sheet of glass, your greenhouse does not retain 180% of the re-radiated infrared light. That would be absurd. Instead, the second sheet reflects or absorbs 90% of the 10% that got through the first sheet. A third sheet would reflect or absorb 90% of the 1% that got through the first two sheets.... An infinite number of sheets of glass could only reflect or absorb 100% of the re-radiated infrared light. Now re-read this paragraph, mentally substituting “atmospheric carbon dioxide” for “glass.”
Models Don’t Get It Right
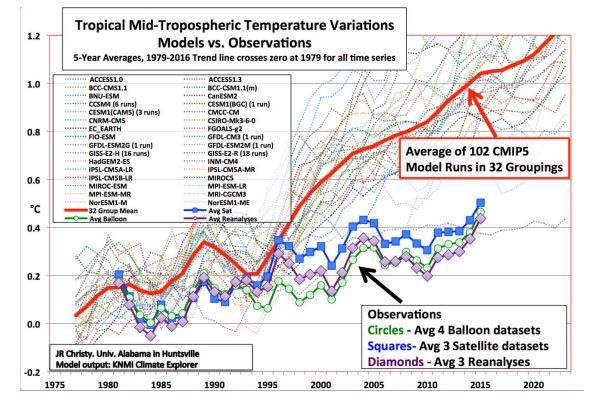
Mark Twain said “Prediction is difficult. Especially about the future.” Time-series computer models (dotted gray lines in the image below) ought to be able to “predict” the past, which can be verified against measurements. 101 of 102 climate models utterly fail when started with 1975 data and then “predict” what happened during the last fifty years, especially after 1995. Whose model is that one outlier, that seems to get things right? The Russian model.
Conclusion
The claim that “climate change” is exclusively or even primarily driven by humans burning fossil fuels is based on four decades of Lysenkoism posing as science. Paul Ehrlich, Amory Lovins, Michael Mann, and Al Gore have done more damage to world science than Trofim Lysenko did to Soviet genetics.

"They wrote this at the time when “scientists” were worrying about the coming ice age. If burning fossil fuels couldn't prevent the coming ice age, how could burning fossil fuels cause global warming? If this is still a mystery, re-read the section above about how much CO2 warms the Earth."
Follow the money, they did!
Good introduction to the article. I’m a warming skeptic in both pro and contra directions.
I can believe that CO2 levels were a result, not a cause, of temperature changes in millennia past. Today’s situation differs, with such rapid injection of CO2 into the atmosphere.
I didn’t understand why the Mann hockey stick graph was different from the prior one. Because it was northern hemisphere?
I’ve seen Happer’s graphic before and read the paper. I’m not competent to judge whether it’s accurate, but it seems reasonable. 1) Why is not that Happer paper in a “peer reviewed” publication? 2) Why is there no serious detailed critique of his method? Who agrees or disagrees with his logic?
Regarding insufficient dilution of cosmic-ray-generated C-14 in the mostly C-12 atmospheric CO2, it seems to me that the “respiration” effect of seasonal vegetation growth/decay might explain that. You can see the “breaths” on the Keeling curve at seasonal and even daily intervals. There’s a lot more C in the the earth (and sea) than the atmosphere.
Bob Hargraves